Alexandra Wagner
Back to all work

Huel and Food Access

Could Huel reach households struggling with food costs?

Focus
Sustainable design strategy · Stakeholder mapping · Theory of change · Measurement · Team leadership
View the full presentation

Our team developed a proposal for a lower-cost Huel brand, with a plan to test affordability, repeat use, and commercial viability.

The brief

For a five-person Sustainable Design Strategies project, we examined how Huel, a B Corp meal-replacement company, could serve UK households experiencing food insecurity. The proposal supported the UN’s Zero Hunger goal and explored an audience beyond the health-conscious customers Huel typically markets to.

This was a coursework proposal. The rollout and outcomes below describe what we recommended testing.

Approach

We mapped the people and organizations involved, looking at their influence, interests, and what they might gain from the proposal. Our power–interest map identified stakeholders’ influence and interest. A value map showed what Huel currently captured, what it missed, and what it could create. These informed the concepts we developed.

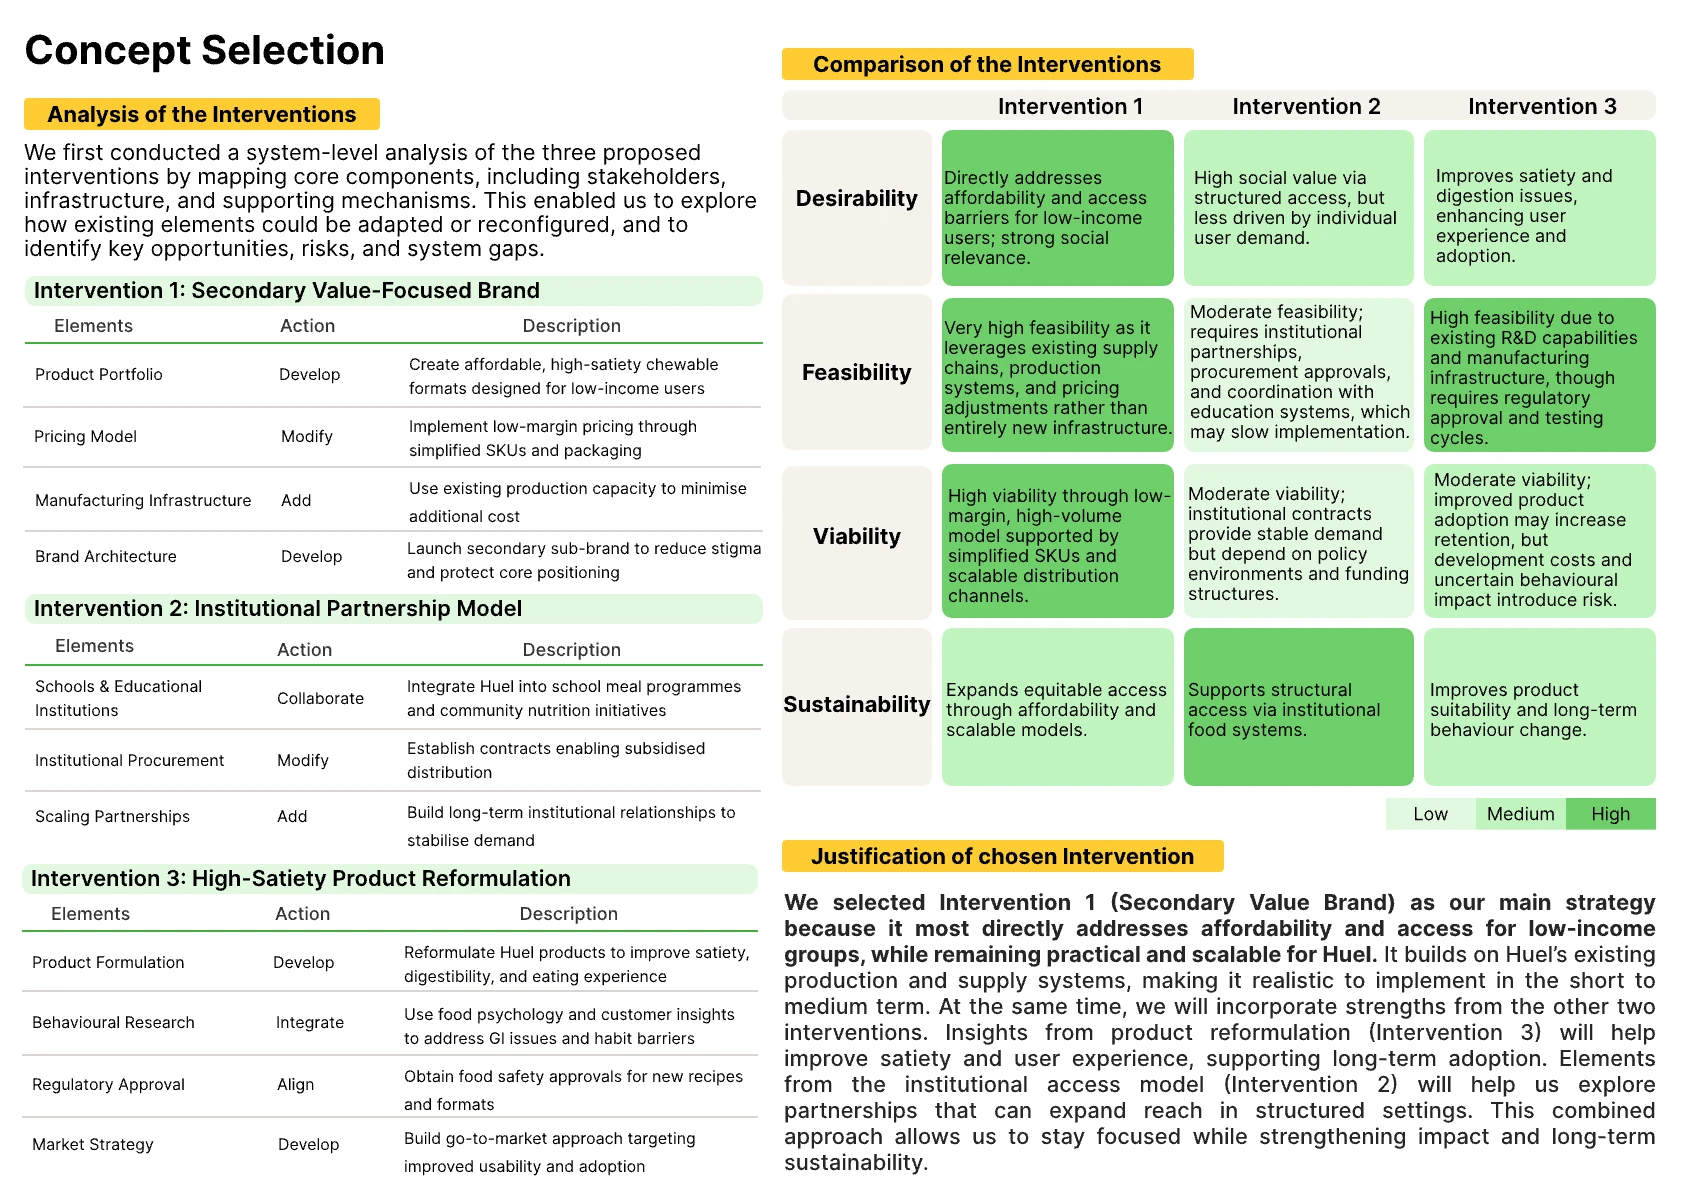
We compared three approaches: a lower-cost brand, institutional partnerships, and product reformulation to improve fullness. We assessed each for desirability, feasibility, viability, and sustainability before developing the selected proposal.
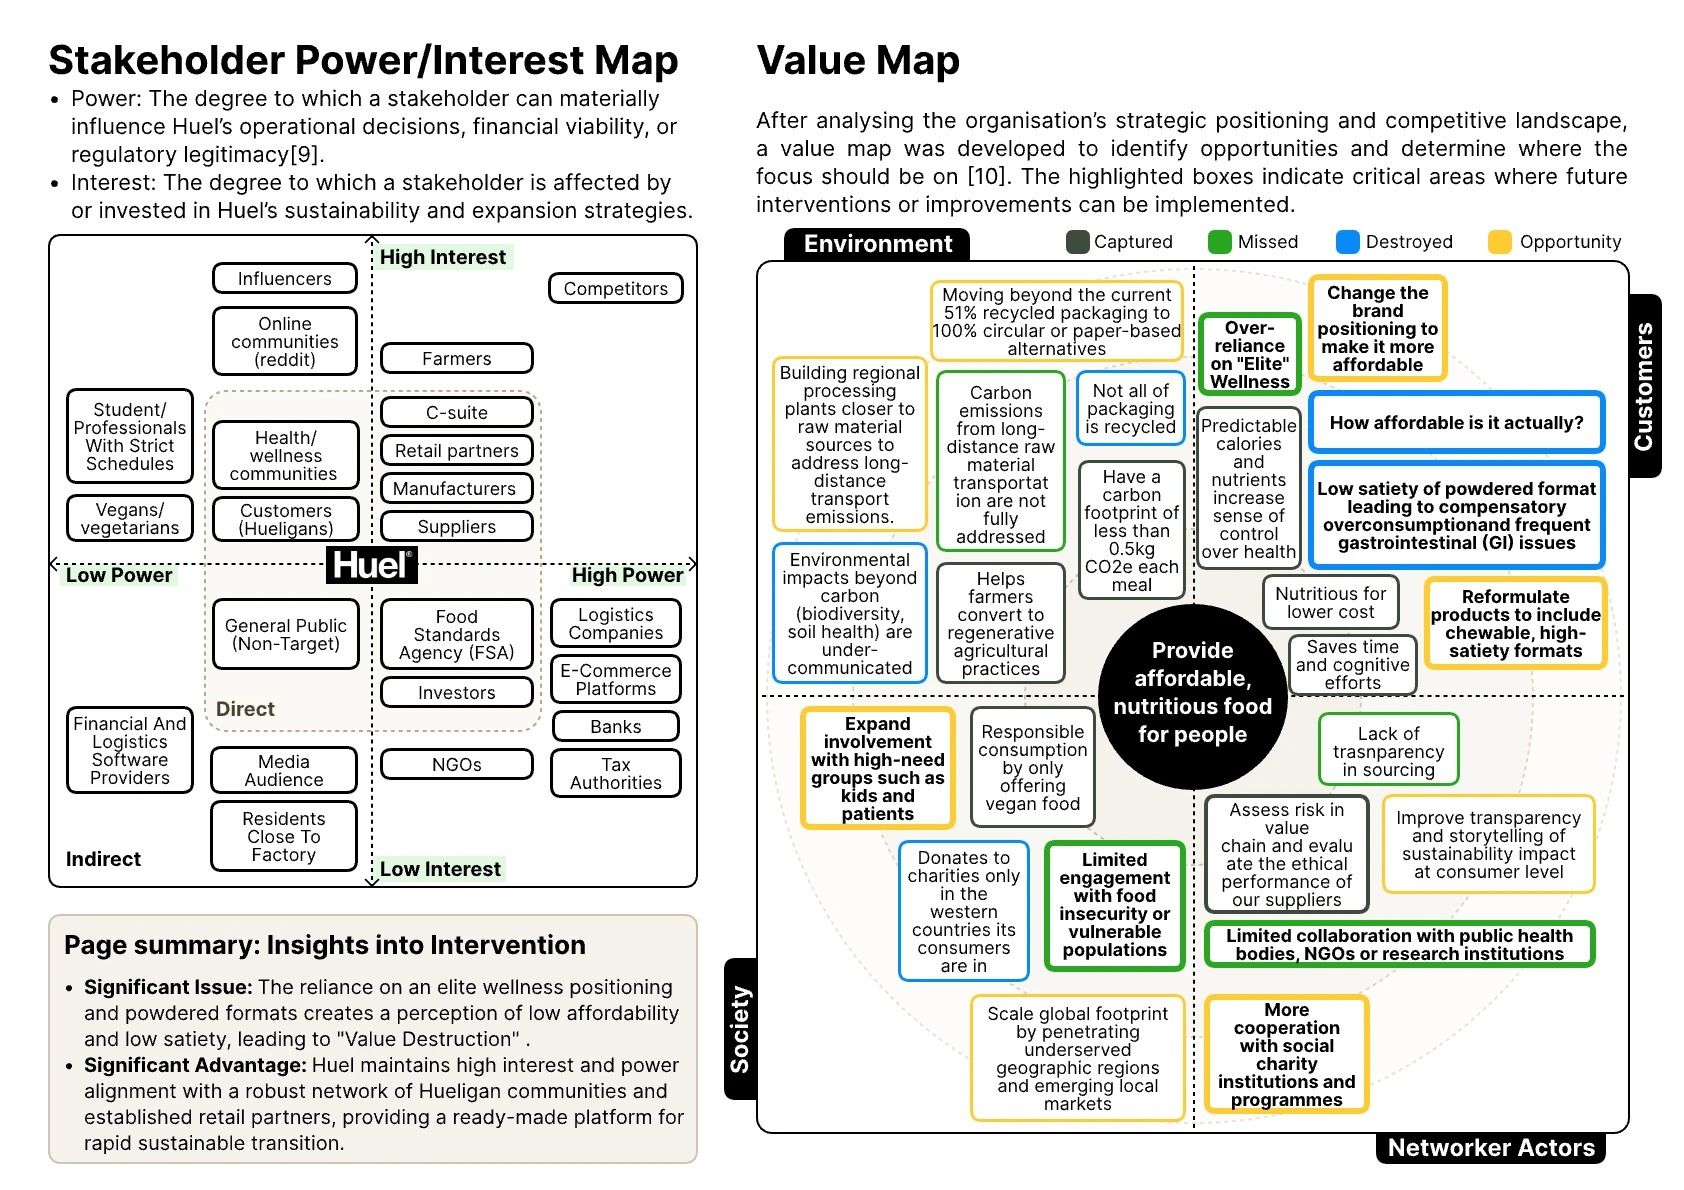
Two panels: a stakeholder power/interest map placing Huel’s stakeholders from low to high power and interest, and a value map of value captured, missed, destroyed and opportunities across environment, society, customers and network actors
Figure 1. Our stakeholder and value maps.
Concept selection: three interventions (a secondary value-focused brand, an institutional partnership model, and high-satiety product reformulation) broken into elements and actions, compared on desirability, feasibility, viability and sustainability, with the justification for choosing Intervention 1
Figure 2. Comparing the three proposals and their trade-offs.

The proposal

We proposed a separate, lower-cost Huel brand for households struggling to afford sufficient food. It would use a smaller product range, simpler packaging, and bulk distribution to help keep costs down.

The proposal included a chewable product designed to be filling, with taste, comfort, and satisfaction tested before wider distribution. NGOs, food banks, and community organizations would help reach the intended households, alongside selected institutional partners.

The business model would need to work at lower margins without relying on donations. We therefore included measures of both household adoption and the effect on Huel’s existing business.
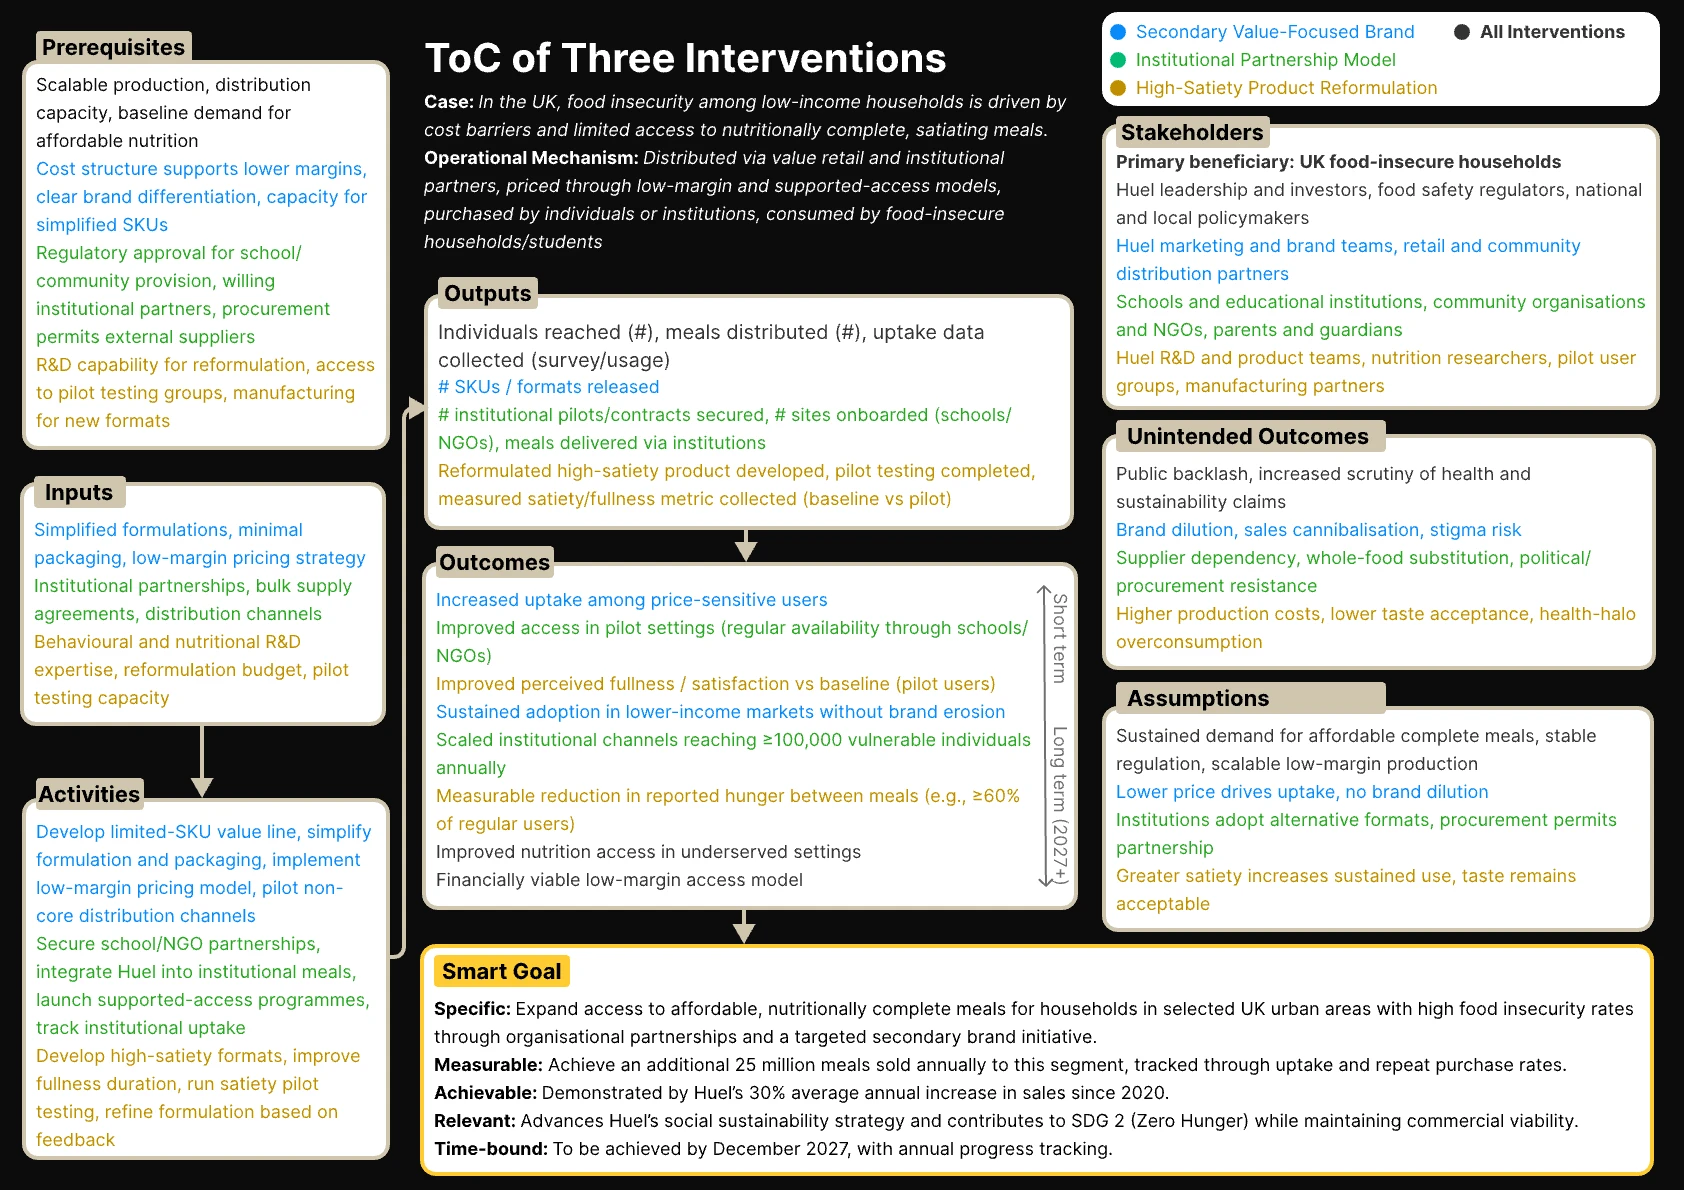
Theory of change linking prerequisites, inputs, activities, outputs and outcomes to a SMART goal, with stakeholders, unintended outcomes and assumptions listed alongside
The theory of change connects inputs and activities to short-, medium-, and long-term outcomes and measurable indicators.
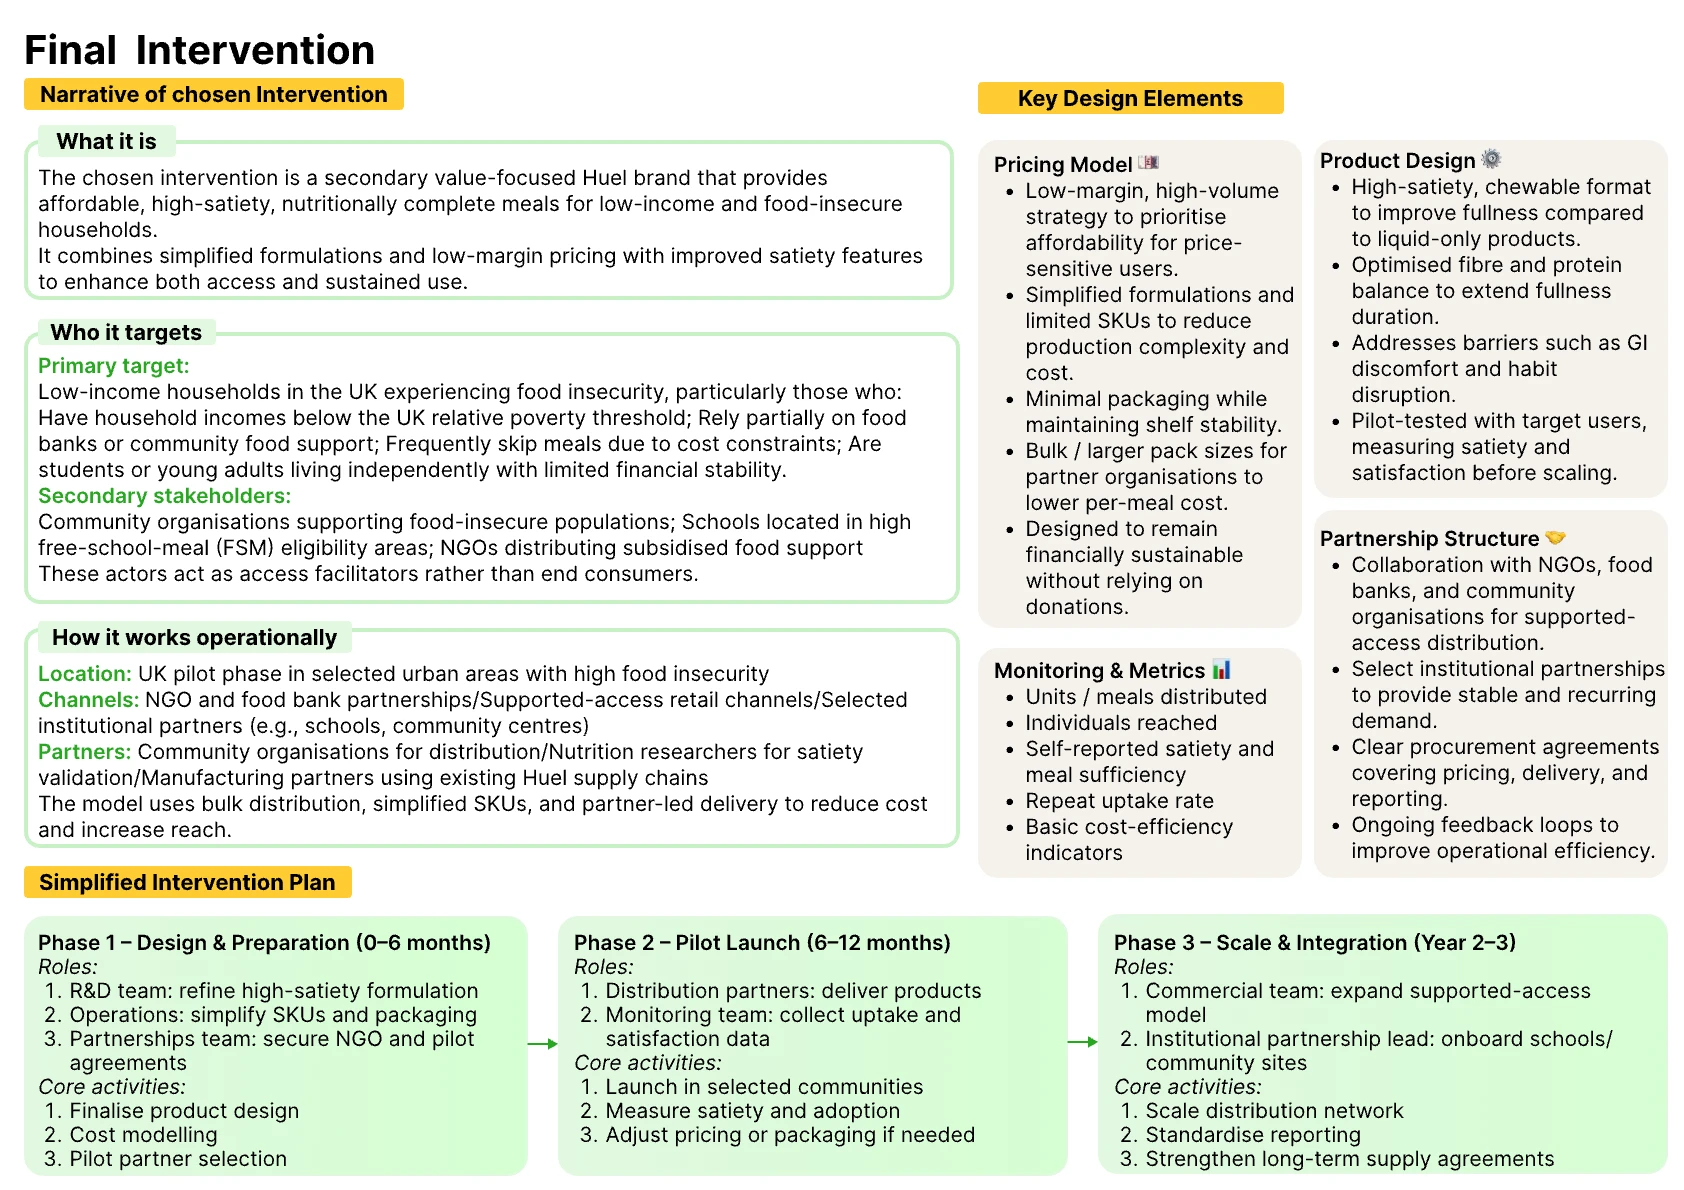
Final intervention: what it is, who it targets and how it works, key design elements for pricing, product, partnerships and monitoring, and a three-phase plan from design and preparation through pilot launch to scale and integrate
The selected concept and proposed rollout.

A staged rollout

Stage
Proposed work
Design and preparation: months 0–6
Refine the product, model costs, and select pilot partners
Pilot: months 6–12
Launch in selected communities, measure uptake and satisfaction, and adjust pricing or packaging
Expansion: years 2–3
Expand distribution if adoption and cost targets are met, while monitoring the existing business

How we would measure progress

I defined two intended outcomes: initial adoption among price-sensitive households within three to six months, followed by repeat use over six to 12 months without materially harming the existing brand.

The proposal set a target of 25 million additional meals annually by 2027. That was a planning target, not an achieved result.

Indicator
What it would tell us
How we would measure it
Uptake among target households
Whether the offer reaches people who choose to try it
First-time buyers divided by target households reached, using partner tags and purchase records
Total meals sold
Whether distribution is growing toward the annual target
Monthly sales, segmented by target audience and reviewed across 12 months
Repeat purchase
Whether people return after trying it
The share of buyers making at least two purchases within three months
Existing-brand stability
Whether the new offer affects the core business
Existing-product sales, brand perception surveys, and evidence of customers switching to the cheaper range
Intended outcomes and the indicators proposed to track them.

The outcomes we would test

Outcome 1

The first outcome was adoption within three to six months: price-sensitive households that had not previously bought the product would begin purchasing the lower-cost range. This would indicate that affordability barriers had fallen and help test the market-entry approach against the 25 million meal target. The main uncertainties were the accuracy of income segmentation and the reliability of NGO tracking.

Outcome 2

The second outcome was sustained use within six to 12 months, with repeat purchases in lower-income markets while premium revenue and brand perceptions stayed stable. This would help establish whether the proposal could grow without weakening the business supporting it. Brand perceptions might lag behind purchasing behavior, and effects could vary by distribution channel.

Indicator 1Uptake among target households
Why it matters
People need to try the offer before wider access can contribute to the Zero Hunger goal. Without uptake, the meal-volume target would be unattainable.
Measure
First-time buyers divided by target households reached, multiplied by 100. The assumed pre-launch baseline was approximately zero penetration.
Collection
Identify households through NGO or postcode tags, record first purchases in point-of-sale or customer systems, and report uptake quarterly.
Interpretation
Uptake would reflect the combined response to pricing, distribution, and partnerships. We proposed comparing regions and using the report’s 20–40% fast-moving consumer goods pilot benchmark, with a 30–40% target for the pilot.
Feasibility
High, using existing purchase systems with audience-segmentation tags added.
Indicator 2Total meals sold
Why it matters
Annual meal volume tracks the scale of access and progress toward the 25 million meal target. Together with premium-brand stability, it tests social reach against commercial sustainability.
Measure
Total meals sold over 12 months. Growth would be calculated as the change from baseline divided by baseline, multiplied by 100, where a nonzero baseline is available.
Collection
Aggregate monthly sales of the secondary brand, segment by target-household tags, and compare progress with the annual target.
Interpretation
Volume captures the combined effects of adoption and distribution. We proposed comparisons with internal growth targets and previous launches. Tracking a full year helps account for seasonality.
Feasibility
Very high, because standard sales systems already capture volume.
Indicator 3Repeat purchase
Why it matters
A one-time trial does not establish sustained use. Repeat purchasing helps show whether the product is becoming part of people’s routines.
Measure
Buyers making at least two purchases within three months divided by total buyers, multiplied by 100. The starting comparison would be the Month 0 repeat-purchase rate.
Collection
Follow each monthly purchasing cohort over a three-month window and monitor purchase frequency over six to 12 months.
Interpretation
Repeat use would help assess the experience created by pricing, packaging, and availability. The proposed benchmark was at least 30–40% repeat purchase, drawing on meal and subscription categories. Two purchases in three months was intended as a practical signal of early retention.
Feasibility
High, using customer records with a clearly defined observation window.
Indicator 4Premium brand stability
Why it matters
The lower-cost offer needs to remain commercially sustainable. Tracking the existing business helps identify whether customers are switching from premium products instead of the new range reaching additional households.
Measure
The change in premium sales divided by pre-launch premium sales, multiplied by 100, alongside brand perception scores.
Collection
Monitor premium sales monthly against the prior year, run quarterly perception surveys, and look for switching between ranges.
Interpretation
We proposed keeping premium sales within approximately ±5–10% of baseline as a working tolerance for displacement. These figures were planning thresholds to validate, rather than achieved results.
Feasibility
Medium. Sales tracking is available, but brand perceptions require additional measurement aligned with existing portfolio monitoring.

Risks and next steps

The main risks included low uptake, dissatisfaction with the product, distribution costs, and existing customers switching to the cheaper range. We proposed distinct branding, testing with the intended audience, and monitoring sales and repeat purchases before expanding.

Distribution also depended on reliable partners. The plan included common reporting processes, clear agreements, and several types of partner to reduce reliance on any one organization.

The next steps were to confirm the product and cost assumptions, recruit pilot partners, and set up measurement before the first distribution cycle. Expansion would depend on evidence from the pilot.
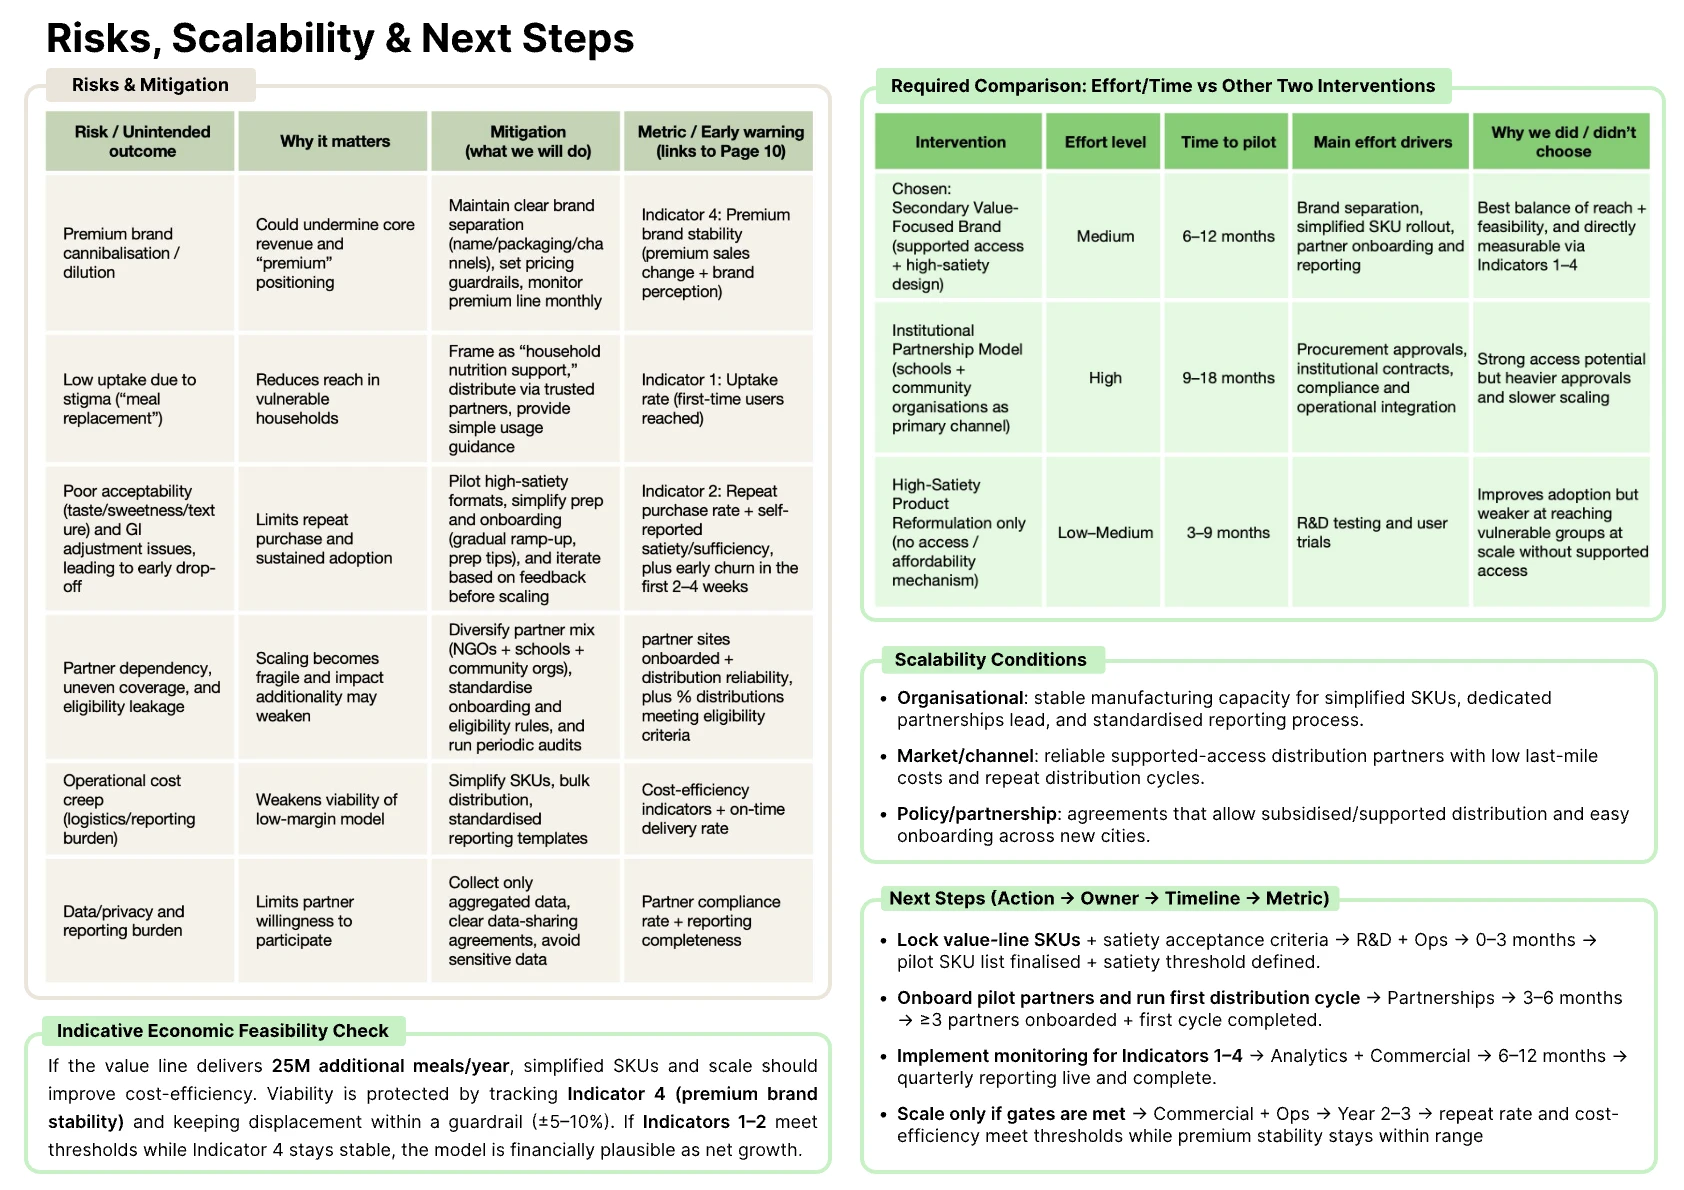
Risks, scalability and next steps: a risk and mitigation table with early warning metrics, a comparison of effort and time to pilot across the three interventions, scalability conditions, and next steps
Figure 6. Key risks, proposed mitigations, and conditions for expansion.

My role

I acted as product manager for the team. I set the roadmap, divided the work, and ran our meetings. When deadlines slipped or we disagreed on the direction, I helped the group decide what to do next.

I also wrote the theory of change, the intended outcomes and measurement plan, and the risk section.

Next project
Della
A shared card that charges each friend their share when the group pays.